OpenTelemetry (OTel) Protocol (OTLP)
Концепция OpenTelemetry (OTel) объединила OpenTracing + OpenCensus.
Зачем
- Слабая связность средств инструментирования (логи, метрики, трассировки) и сервера сбора данных Observability
- Стандартизированный формат данных для отправки на сервер сбора данных Observability
- OpenTelemetry, the promise is that the same naming, concepts, abilities, conventions, etc. will be there in every language you use in your project. It brings universality to the telemetry world.
- Простота замена сервера сбора данных Observability
- APIs and SDKs for all the signals are independent of the backends you use for collecting the signals. You don’t have to worry about tight coupling with the solution you choose for storing the telemetry data (eg. Prometheus).
- Цель OTel - предоставить набор стандартизированных независимых от поставщика SDK, API и инструментов для приема, преобразования и отправки данных в серверную часть Observability
- Vendor Lock исключить
- Receivers - Input Data Collector
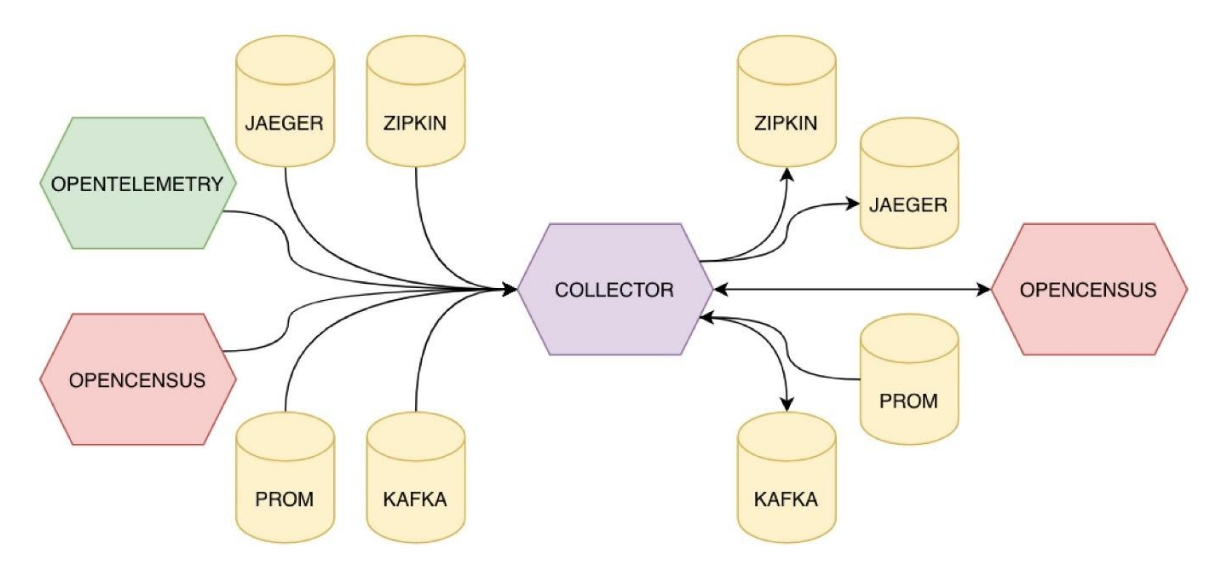
- Metric
- Trace
- OTEL Instrumentation Library, Agent, 2 modes of operation:
- you can either use the OpenTelemetry API to manually instrument the telemetry collection from your application
- or you can use automatic instrumentation techniques that have already been implemented for some languages.

- Data OTEL Collector
- Exporters - SDK realize
- Metric
- Prometheus Metric

- Victoria Metrics
- Prometheus Metric
- Trace
- Jaeger
- Zipkin
- Grafana Loki
- Logs correlation with Trace API SDK beta
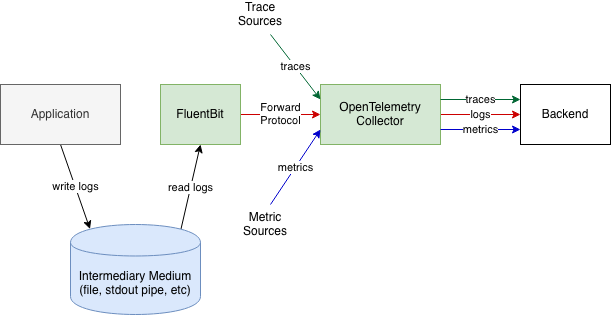
- FluentBit, can collect logs, then send to OpenTelemetry Collector
- Vector support logs
- JS
- Metric
- Roadmap Spec
- Receivers
- Exporters
- OTLP
- Tracing: Stable
- Metrics: Stable
- Logs: Stable
Термины
- Span
- Trace
- Baggage
Архитектура
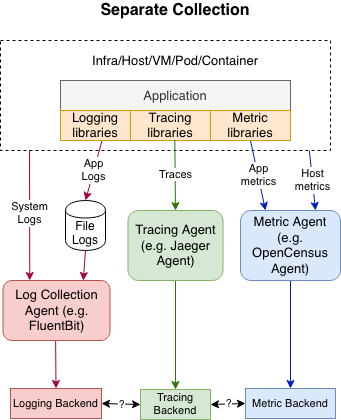
- typical non-OpenTelemetry observability collection pipeline
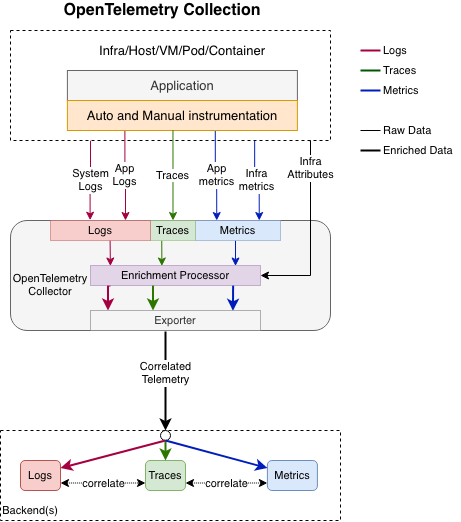
- typical OpenTelemetry observability collection pipeline

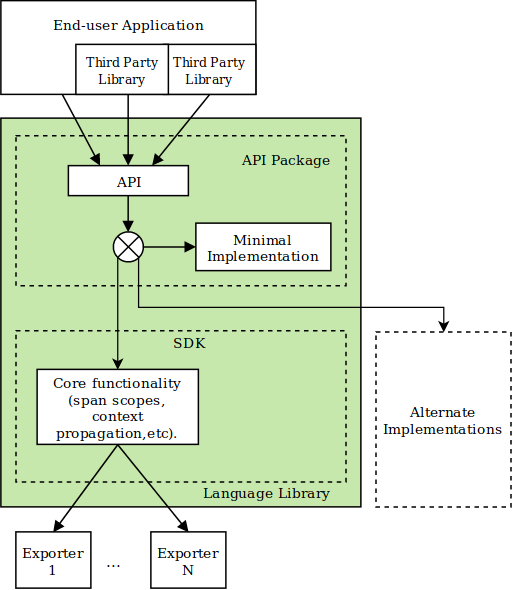
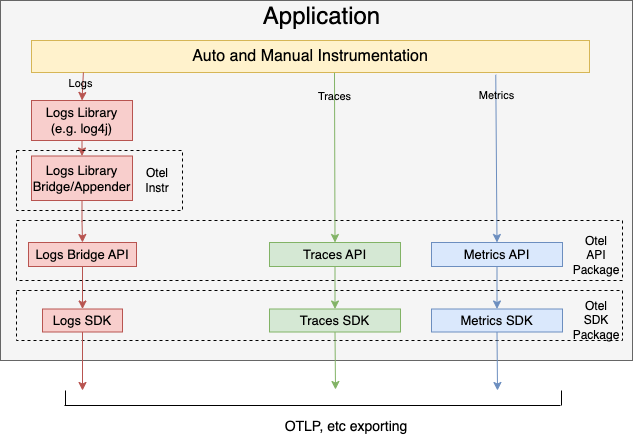
Based on the Specification, the APIs and SDKs are implemented. There’s a noteworthy distinction between the two:
- APIs consist of all the abstractions used for instrumentation, clearly decoupled from their actual implementations. The APIs do not contain the working functionality (they are only there to define what is going to be collected).
- An important part of the SDK is the exporters. After collecting the telemetry signals from your application,
- either directly (using the manual instrumentation approach)
- or indirectly (using the auto-instrumentation), you have to actually emit them. To do that, you have to use an SDK exporter and configure it to send data to a particular destination.
- Such a destination can be
- a telemetry backend of your choice (such as Prometheus, New Relic or Jaeger)
- or an OpenTelemetry collector
- SDKs consist of all the parts that actually implement the APIs and provide the working functionality for collecting and exporting all the signal data.
Reference
- МТС Go
- NGINX ref architecture MARA: ELK - Jaeger - Prometheus - OpenTelemetry
- NGINX ref architecture Microsevice trace
OTEL Collector
- You can export the signals
- directly to the backend
- of your choice directly from the OpenTelemetry exporter in your application.
- The goal here is to unify the process of telemetry data processing so that you don’t have to set up communication with multiple telemetry tools separately. You just configure one collector that is able to communicate with all the tools, and run it alongside your application (eg. in a docker container).
- provides you with some extra functionality you normally might not have, such as retrying, batching or encryption.
Logs
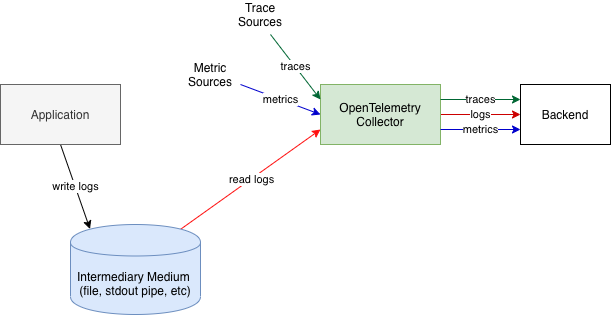
- stduot, file logs
- FluentBit
- Direct
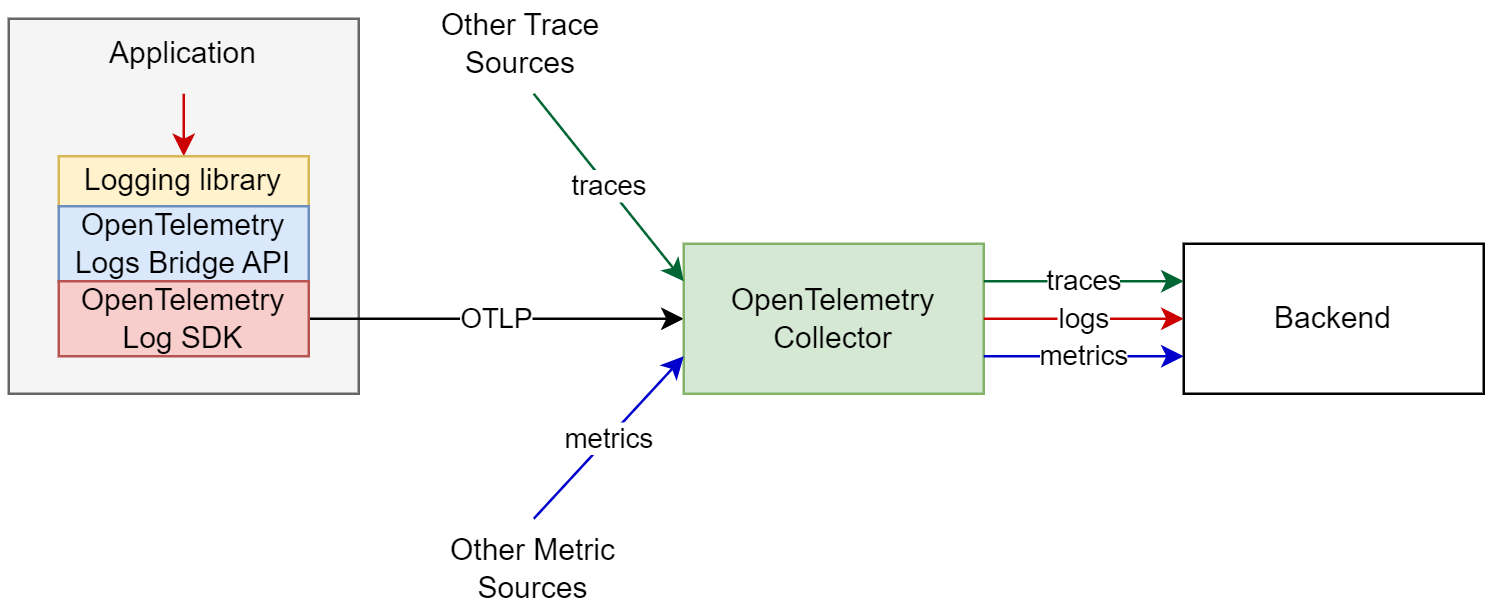
- New First-Party Application Logs
OTLP - OpenTelemetry (OTel) Protocol
- OTLP defines the encoding of telemetry data and the protocol used to exchange data between the client and the server.
- This specification defines how OTLP is implemented over gRPC and HTTP 1.1 transports and specifies Protocol Buffers schema that is used for the payloads.
- OTLP is a request/response style protocols: the clients send requests, the server replies with corresponding responses. This document defines one requests and response type: Export.
- All server components MUST support the following transport compression options:
- No compression, denotated by none.
- Gzip compression, denoted by gzip.
Технологии
- TODO
- Demo Official Docker + Jaeger + OTEL Collector + Grafana + Feature Flags
- JS
- VueJS
- Node JS Server example with SigNoz
- Grafana + Grafana Loki (logs) + Grafana Tempo + Jaeger (trace) + Prometheus\Zabbix (metric)
- Beta RUM Grafana Faro OTEL JS SDK + Grafana Phlare
- Возможности
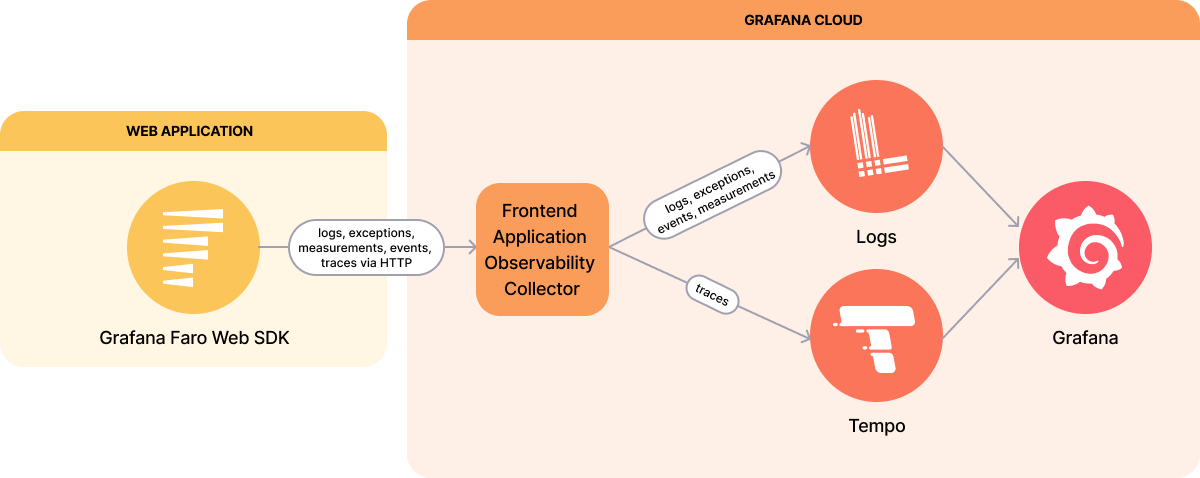
- Grafana Phlare provides an open-source (GNU Affero General Public License v3.0) backend for storing and querying profiling data.
- Возможности
- Beta RUM Grafana Faro OTEL JS SDK + Grafana Phlare